Debugging Notes: Useful Tools
Methodology
Resource: Linux Performance Tools, Brendan Gregg
anti-methods
- streetlight: don’t just use tools that are familiar
- drunk man: fix random things
methods
- problem statement
- What makes you think there is an issue?
- Has the system ever performed well?
- What has changed recently?
- Is the performance issue in latency or
- workload characterization
- Who is causing the load? PID, UID, IP address
- Why is the load called? code path, stack trace
- What is the load? IOPS, tput, type r/w
- How is the load changing over time?
- USE method
- For every resource, check:
- Utilization (busy time)
- Saturation (queue length)
- Errors
- Helps to have functional (block) diagram of system
- For every resource, check:
- off-CPU analysis
- CPU Profile (flame graph)
- Understand all software > 1%
Observability tools
Do your tools cover these parts of the system?
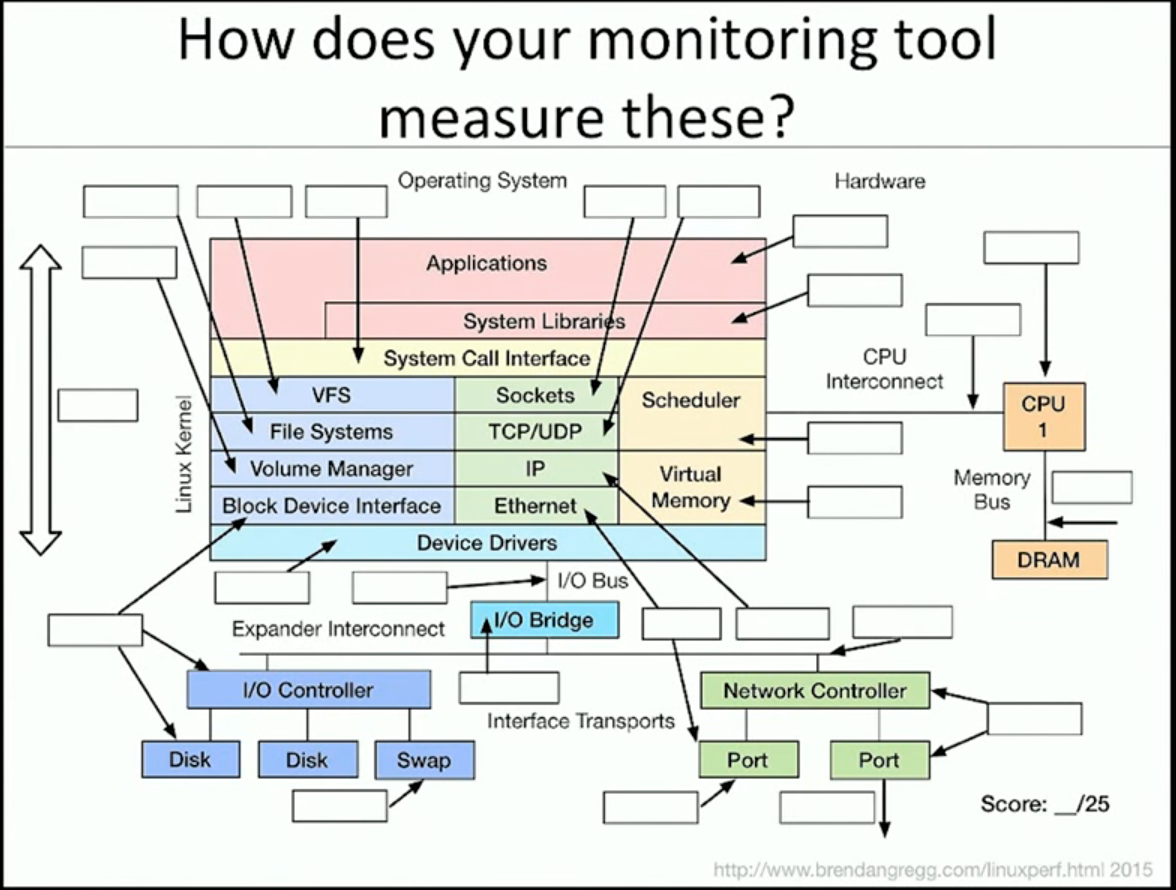
Some basic tools:
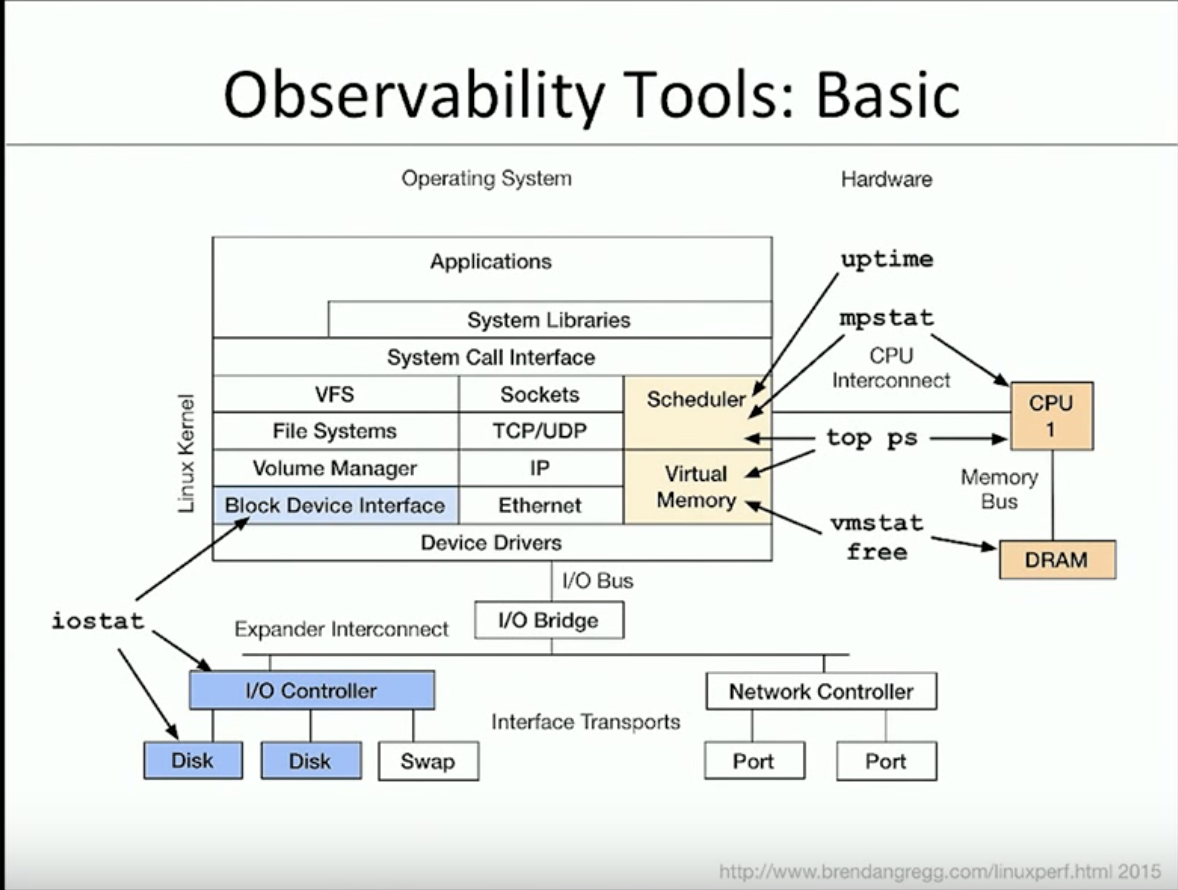
uptime
- load averages. Very old, predates UNIX
- only look at for 5s if load is close to 0.00
- If load greater than num of cpus, indicates an issue
top
- System and per process summary
- Can miss short lives processes
ps
- process status listing
ps -ef f
vmstat
- virtual memory statistics
- vmstat [interval [count]]
iostat
- disk stats
mpstat
- per CPU stats
free
sar
- system activity report
- very effective way to explore many parts of the system
sar -n DEV 1: show activity from network (-n) devices (DEV)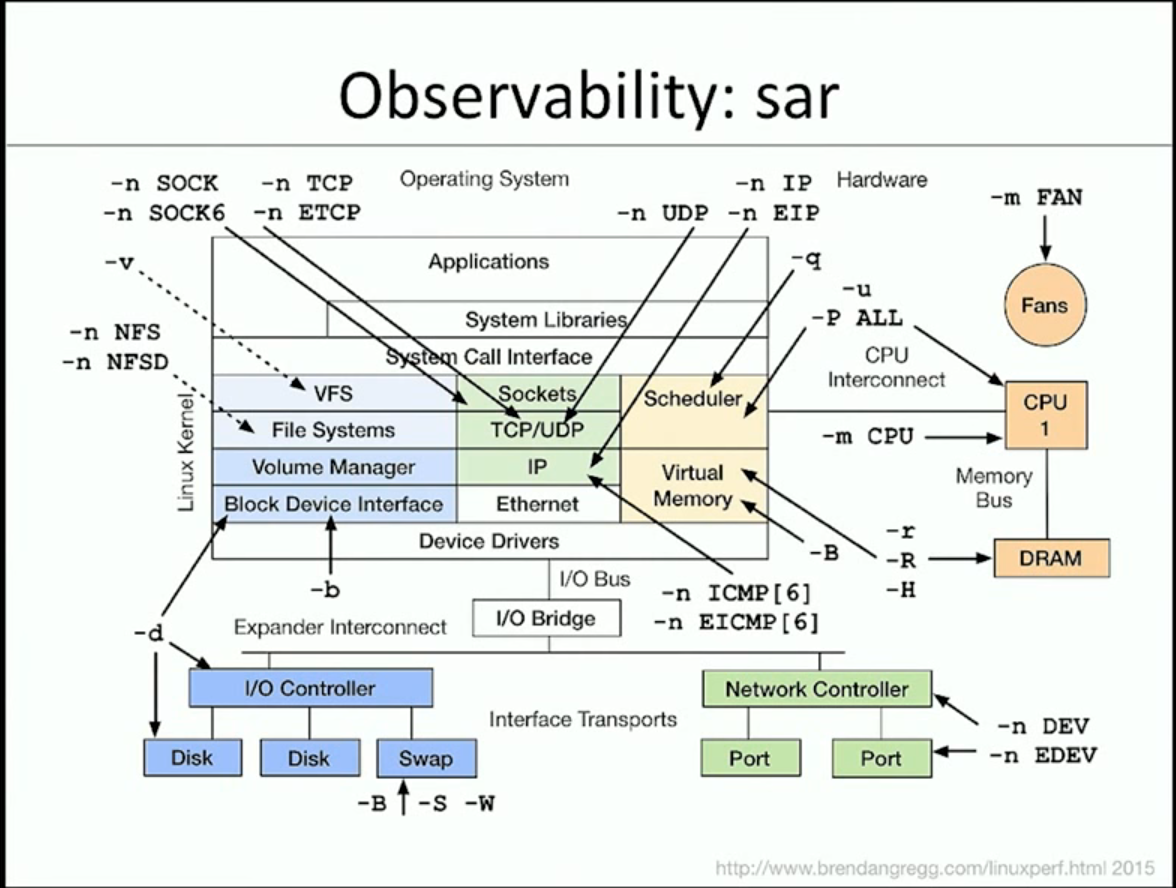
Networking: Tools
Ping
MTR
- MyTraceRoute
- Similar to
topbut for networking mtr -4b google.com- shows hops and packet loss, -4 for IPv4 (shows IPv6 by default), b for show IP addresses and hostnames
tcpdump
- Show all packets on a particular port
sudo tcpdump -n -i any port 53: show me all traffic on port 53 (DNS server lookup port) (-i for interface, here specifying any interface, -n for don’t resolve names)sudo tcpdump -i any port 1234: show me all traffic on port 1234. Could show lots of SYN packets being sent but firewall blocking any connection- sample output:
11:45:31.236938 IP 192.168.0.211.56426 > 192.168.0.1.53: 11330+ A? neopets.com. (29)
Network tab in the browser
- Timings tab shows timings of the request. Can check here if DNS lookups are taking too long for instance
CPU
top
strace
Networking: Techniques
iptables
Resetting iptables counters can help determine if iptables rules are being triggered, and potentially causing an issue.
- Print all iptables rules:
sudo iptables-save - Show counters:
sudo iptables-save -c - Reset counters:
sudo iptables -Z(clears default table)sudo iptables -t nat -Z(clears nat table)
tcpdump
Could check if lots of repeat SYN packets are being sent - could indicate firewall blocking connection.